If you’ve ever felt overwhelmed by stock market jargon, you’re not alone. Words like EPS, ROE, and EBITDA can make investing sound like rocket science. But here’s the truth — once you understand a few of these financial terms, you’ll start to see companies in a whole new light.
Think of financial ratios like the blood test of a business. They’re not flashy or fun, but they quietly reveal what’s working, what’s not, and what’s coming next.
In this post, we’re going to decode five key ratios that every investor should know:
- EPS (Earnings Per Share)
- P/E Ratio (Price-to-Earnings)
- EBITDA
- ROE (Return on Equity)
- ROCE (Return on Capital Employed)
Let’s break them down — no finance degree needed.
Table of Contents
What Are Financial Ratios Anyway?
Imagine you walk into a hospital. You don’t know what’s wrong, but a few blood tests can tell the doctor everything — your sugar, your cholesterol, your risk levels.
That’s precisely what financial ratios do for companies.
They help investors quickly assess:
Is this company profitable?
Is it efficient?
Is it overhyped or undervalued?
Is management doing a good job?
These ratios serve as cheat codes to decipher the nuances of glossy financial reports.
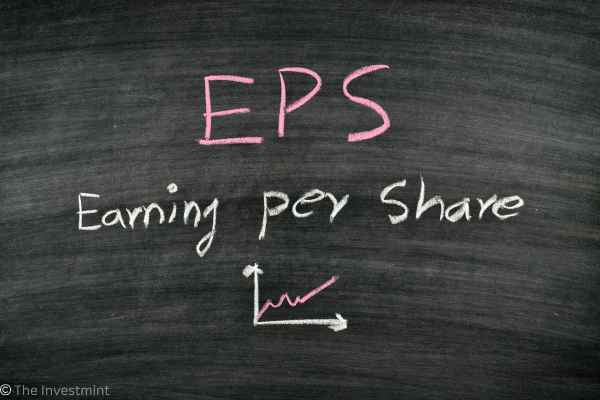
1. EPS: The Slice of Profit You Get

What It Means:
EPS tells you how much money the company made per share of stock. In other words, it’s your slice of the profit pizza.
If a company makes ₹100 crore and has 10 crore shares, the EPS is ₹10.
Simple, right?
The higher the EPS, the better, because it means more profit is being generated per share you own.
A Few Things to Watch:
Rising EPS over time is a great sign.
Companies can artificially boost EPS by buying back their shares (resulting in fewer shares, but a larger share per person).
Always pair this financial ratio (EPS) with other metrics to avoid being misled.
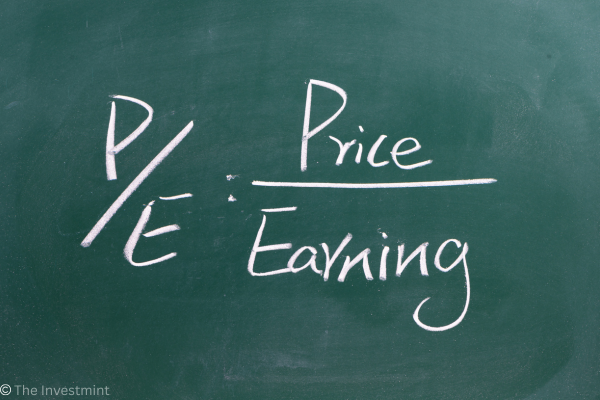
2. P/E Ratio: Are You Paying Too Much?

Think of It Like This:
The P/E ratio compares a stock’s price to its earnings.
It asks: “How much am I paying for ₹1 of this company’s profit?”
If a company’s stock is ₹200 and its EPS is ₹10, the P/E is 20.
You’re paying ₹20 for every ₹1 of earnings.
High vs. Low P/E:
High P/E? The market expects the company to experience rapid growth.
Low P/E? Could be undervalued — or hiding problems.
This financial ratio (P/E) alone doesn’t tell you everything, but it gives a good temperature check on how the market feels about the company.
3. EBITDA: Cutting Out the Noise

Why It’s Useful:
EBITDA stands for Earnings Before Interest, Taxes, Depreciation, and Amortisation.
Yeah, a mouthful.
But in plain English: it’s the money the company makes from its core business, before loans, taxes, and accounting tricks kick in.
Think of this financial ratio (EBITDA) as the raw, unfiltered version of profit.
Example:
Let’s say a company is profitable but has significant depreciation costs associated with its old equipment. EBITDA strips that out and shows you the “clean” profit.
But Be Careful:
Some companies use EBITDA to exaggerate their financial performance.
If a company’s EBITDA is great but its actual net profit is low, dig deeper.
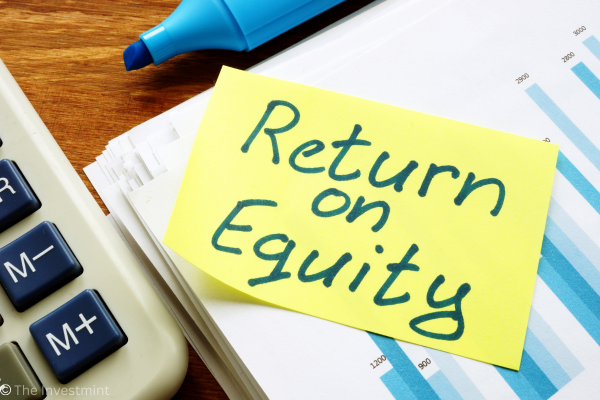
4. ROE: Is Management Doing a Good Job?

The Simple Truth:
This financial ratio (ROE) shows how effectively the company is utilising the money from shareholders (people like you) to generate profits.
Formula? It’s just Net Profit divided by Shareholders’ Equity.
If you put ₹100 into a business and it gives you ₹20 in return, your ROE is 20%.
A Healthy ROE:
A rate of 15–20% or more is generally considered solid.
It means the company is using your money wisely.
However, if the ROE is exceptionally high — such as 40% — consider how much debt the company is incurring. Too much borrowed money can make ROE look prettier than it is.
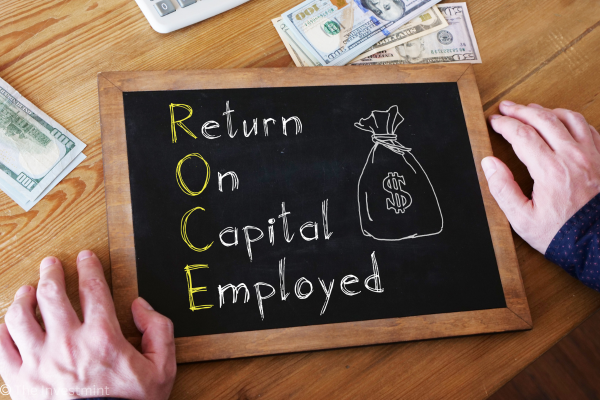
5. ROCE: Is the Company Utilising Its Resources Effectively?

Big Picture Thinking:
While ROE examines shareholder money, ROCE considers all the money in the business, including both debt and equity.
That’s why, this financial ratio (ROCE) is particularly well-suited for capital-intensive industries, such as steel, telecom, or real estate.
It indicates whether the company is generating satisfactory returns on the capital it has invested in the business.
Example:
If the company generates ₹100 crore in operating profit and has a total capital of ₹ 500 crore, the ROCE is 20%.
Consistently high ROCE? That’s a sign of a well-run business.
How These Ratios Work Together
How These Financial Ratios Work Together
Each of these metrics gives you a piece of the puzzle.
Let’s say:
EPS is rising ✅
P/E is reasonable ✅
EBITDA margin is substantial ✅
ROE and ROCE are consistent ✅
That’s a company you’d want to look into more seriously.
But if you see:
EPS rising 📈
P/E sky-high 🚨
ROCE falling 📉
…then slow down. Perhaps the company is hyped but no longer efficient.
It’s not about any single number. It’s about the whole picture.
Red Flags to Watch For
- Rising EPS but falling ROCE? Profits are up, but capital use is worsening.
- High ROE but low ROCE? Debt might be doing the heavy lifting.
- Great EBITDA but negative cash flow? The business isn’t generating a profit.
- Super high P/E and no growth? You’re probably overpaying.
Final Thoughts: Use Financial Ratios Like a Compass
Investing without understanding financial ratios is like driving without a dashboard; it’s a dangerous practice.
These five tools — EPS, P/E, EBITDA, ROE, and ROCE — are your speedometer, fuel gauge, and check-engine light all rolled into one.
Don’t worry about being perfect. Even comparing these numbers across just a few companies can give you a significant edge over 90% of retail investors.
So next time you research a stock, don’t stop at the price chart.
Look under the hood.
Because the real value of a company isn’t in how much it’s trending on social media — it’s in the numbers that never lie.
Also read: What Is the Stock Market and How Does It Work?
Bonus: Quick Checklist for Investors
Before buying any stock, ask yourself:
- Is EPS growing steadily?
- Is the P/E ratio fair for the industry?
- Is EBITDA strong and improving?
- Are ROE and ROCE both healthy?
- Are there any red flags in trends?
This 5-point filter can protect you from bad investments — and guide you toward the right ones.


Your point of view caught my eye and was very interesting. Thanks. I have a question for you. https://www.binance.com/register?ref=IXBIAFVY
Your article helped me a lot, is there any more related content? Thanks! https://accounts.binance.info/ES_la/register?ref=VDVEQ78S